90 offices, one table

USCIS Field Office Directory: I-485 and N-400 Waits

Every USCIS field office with its currently published family-based I-485 and N-400 windows, side by side, sortable, and searchable. Where USCIS publishes no range for a form, the table says so instead of guessing.

USCIS published data · September 17, 2026 · refreshed monthly

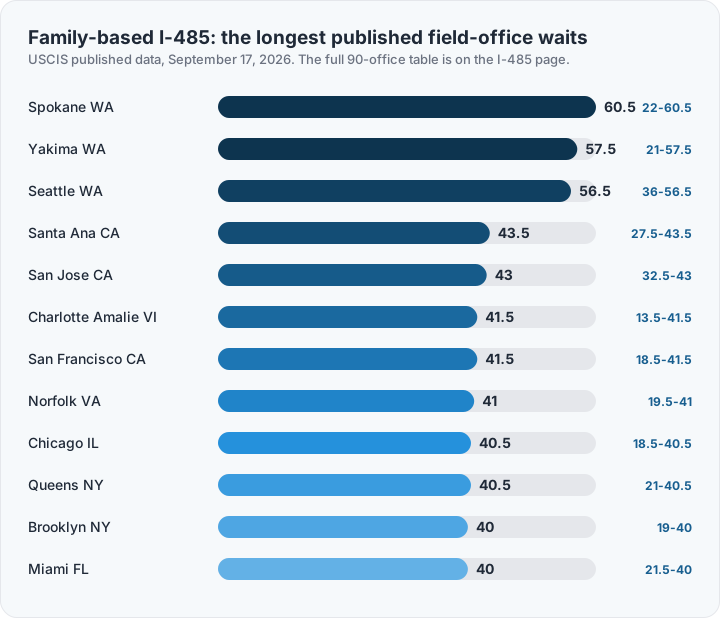
Bar chart of the longest I-485 field office waits
The twelve longest I-485 windows; the table below carries all offices.
All field offices — published 80% windows (September 17, 2026), sorted by I-485 upper bound
Field office I-485 window I-485 trend N-400 window N-400 trend
Spokane WA22–60.5 mo+2.5 mo11.5–13 mo+0.5 mo
Yakima WA21–57.5 mo+24.5 mo13.5–15.5 mo+0.5 mo
Seattle WA36–56.5 mo+2 mo13.5–15.5 mo+0.5 mo
Santa Ana CA27.5–43.5 mo+0.5 mo14–17 mo+0.5 mo
San Jose CA32.5–43 mo+0.5 mo16–31.5 mo+5.5 mo
Charlotte Amalie VI13.5–41.5 mo+2 mo11.5–15 mo+5 mo
San Francisco CA18.5–41.5 mo-1.5 mo14.5–22.5 mo+4.5 mo
Norfolk VA19.5–41 mono change10.5–13.5 mo+1.5 mo
Chicago IL18.5–40.5 mo+1.5 mo13–19.5 mo+3 mo
Queens NY21–40.5 mono change10.5–15.5 mo+1.5 mo
Brooklyn NY19–40 mono change11–15 mo+2 mo
Miami FL21.5–40 mono change10–15 mo+1 mo
Raleigh NC24.5–40 mo+1.5 mo12–16 mo+2 mo
Denver CO22.5–39.5 mo+0.5 mo14–18 mo+1 mo
Lawrence MA20.5–39.5 mo+1 mo18–20 mo+0.5 mo
Oklahoma City OK20.5–39 mono change13–15.5 mono change
Oakland Park FL22.5–39 mono change12.5–19 mo+0.5 mo
Sacramento CA18–39 mo+0.5 mo16–24 mo+0.5 mo
Los Angeles County CA17.5–38.5 mo+1.5 mo10.5–14 mono change
San Fernando Valley CA13–38.5 mo+2 mo13–15.5 mo+1 mo
Agana GU21.5–38 mo-4 mo13–18.5 mono change
Newark NJ22–38 mo+1 mo11.5–15.5 mo+1 mo
Boise ID18–37.5 mo+7 mo15–17.5 mo+1 mo
Christiansted VI18–37.5 mo+0.5 mo11.5–15.5 mono change
Fresno CA16–37.5 mo+2.5 mo15.5–19.5 mo+2.5 mo
Honolulu HI18.5–37.5 mo+0.5 mo12.5–16.5 mo+1.5 mo
Los Angeles CA15–37 mo-1.5 mo10.5–14 mo+1 mo
Portland OR16–37 mo+3 mo14.5–17.5 mo+1 mo
New Orleans LA21–36.5 mo-1 mo12.5–17 mo+0.5 mo
Portland ME22.5–36.5 mo-3 mo14.5–19 mo+2 mo
Reno NV18–36.5 mono change11.5–15 mo+1.5 mo
Houston TX18–36 mo+2 mo12–14 mono change
Las Vegas NV19–36 mono change13–16 mo+1 mo
Columbus OH14–35.5 mono change10.5–14 mo+1.5 mo
Indianapolis IN22–35 mo+3.5 mo14–16.5 mo+1 mo
Detroit MI14.5–34.5 mo+1 mo13–16.5 mo+1.5 mo
Cranbury NJ17–34.5 mo+2 mo9–12 mo+1 mo
Minneapolis-St. Paul MN16.5–34.5 mo-0.5 mo14.5–20 mono change
Mount Laurel NJ21.5–33.5 mo-1 mo10–14.5 mo+0.5 mo
New York City NY14.5–33.5 mono change10–12.5 mo+0.5 mo
Imperial CA12.5–33 mo-2 mo14.5–18 mo+2 mo
Long Island NY16.5–33 mo-1.5 mo12–17 mo+1 mo
Memphis TN22.5–33 mo+3.5 mo12–16 mo+1.5 mo
Orlando FL18.5–33 mo+1.5 mo13.5–19 mo+2 mo
San Bernardino CA19–33 mo+1.5 mo13–17.5 mo+0.5 mo
Baltimore MD19–32.5 mo-4 mo15–20.5 mo+3 mo
Jacksonville FL17–32.5 mo+1.5 mo15–18 mo+1.5 mo
Milwaukee WI15.5–32.5 mo-1 mo14–17.5 mo+1.5 mo
Hartford CT14.5–31.5 mo+3 mo11.5–14 mo+1.5 mo
San Diego CA13–31.5 mo+2.5 mo15.5–23 mo+1.5 mo
Atlanta GA16.5–31 mo+0.5 mo13.5–17 mo+3 mo
Charlotte NC18–31 mo+1 mo11–14.5 mo+0.5 mo
Philadelphia PA15–31 mo+1.5 mo11.5–15 mo+1.5 mo
Cleveland OH15.5–30.5 mo-2.5 mo10.5–14.5 mo+2.5 mo
San Juan PR14.5–30 mo-9 mo9.5–11 mo+1 mo
Anchorage AK9.5–29.5 mo+2.5 mo12.5–19 mo+2.5 mo
Fort Myers FL20–29.5 mo+1.5 mo15.5–19.5 mo+2 mo
Dallas TX13.5–29 mo+3 mo13–16.5 mo+0.5 mo
Kendall FL14.5–29 mo+1 mo10–13.5 mo+1.5 mo
West Palm Beach FL16.5–29 mo+1 mo10–16.5 mo+2 mo
Boston MA13.5–28.5 mono change13.5–15.5 mo+1 mo
Wichita KS11.5–28.5 mono change13–18 mo+2.5 mo
Albuquerque NM13.5–28 mo+1.5 mo13–17.5 mo+0.5 mo
Hialeah FL14–27.5 mo-3.5 mo9.5–12.5 mo+2 mo
Kansas City MO14–27 mo+3.5 mo12.5–15 mo+1.5 mo
Pittsburgh PA14–27 mo+1 mo11.5–14.5 mono change
Albany NY15–26.5 mo-2 mo10–13 mo+1.5 mo
Tampa FL17–26.5 mo+3 mo13.5–16.5 mo+1 mo
Cincinnati OH14–25 mo-2.5 mo9.5–13 mo+1.5 mo
Saint Louis MO12–25 mo-1 mo12.5–14 mo+1 mo
Louisville KY12.5–24.5 mo+3 mo10.5–14.5 mo+1.5 mo
Phoenix AZ14–24.5 mo-1.5 mo12–13 mo+0.5 mo
San Antonio TX13–24.5 mo+1.5 mo11.5–13.5 mo+0.5 mo
Washington DC18–24 mo+0.5 mo11.5–14.5 mo+1.5 mo
Nashville TN13.5–23.5 mo+4 mo13–17 mo+4 mo
Harlingen TX11–23 mo-1 mo11.5–16 mono change
Des Moines IA14.5–22.5 mono change13.5–16.5 mo+1.5 mo
El Paso TX12.5–22.5 mono change13–15 mono change
Charleston SC13.5–21.5 mo+1.5 mo11.5–15 mo+1 mo
Manchester NH13–21.5 mo+1 mo10.5–13.5 mo+0.5 mo
Montgomery AL13.5–21.5 mo+4 mo9.5–12 mo+0.5 mo
Salt Lake City UT15–21.5 mo+1 mo13.5–16 mono change
Fort Smith AR15–21 mono change11–13 mo+1 mo
Omaha NE12–21 mono change12.5–14.5 mo+0.5 mo
Providence RI12.5–21 mono change10–13 mo+0.5 mo
Greer SC15–20.5 mo+1 mo10–13.5 mo+1.5 mo
Buffalo NY10–17.5 mo+0.5 mo14.5–17 mo+2 mo
Helena MT9.5–14.5 mo+0.5 mo9.5–11.5 mo+0.5 mo
Tucson AZ8.5–13.5 mo-1 mo12–14 mo+0.5 mo
Burlington VT8.5–12.5 mo+2 mo10.5–12 mo+0.5 mo

How to use this directory honestly

Two caveats keep this table useful instead of misleading. First, jurisdiction follows residence: you cannot shop for a faster office, and a case transferred after a move is measured at the new office's queue from transfer. Second, a missing range means USCIS published none for that office and form — too few completions recently for an honest envelope. We mark it “not published” rather than inventing a substitute, which is also why this table will never be perfectly full.

For reading the trend markers, the rule is the same everywhere on this site: green down is improving, red up is lengthening, and the comparison is always against the previous official release — the one USCIS overwrites and does not show you. The I-485 and N-400 pages add per-office inquiry dates and the process context these numbers live in.

Frequently asked questions

Can I choose a faster field office?

No. Jurisdiction follows where you live — moving to a faster office's area and transferring the case is a real but drastic step with its own risks, and the new office's published range applies from transfer.

Why do some offices have no published range for a form?

USCIS omits ranges where too few cases completed recently to make a honest envelope. The directory marks them so nobody guesses.

Are these numbers the same as USCIS's own tool?

The numbers come from USCIS's published processing times; this directory reorganizes all offices into one sortable, comparable view and keeps the recent history USCIS does not display.